Sunday, June 30, 2013

Broken Record

Repetition of the same thought or physical action develops into a habit which, repeated frequently enough, becomes an automatic reflex.Norman Vincent Peale

I know this blog, now only a month old, sounds like a broken record.  Supply and demand, support and resistance,  volume, <insert offensive comments>, blah blah blah.  However, the quote above is exactly what I'm shooting for.  Just like a good athlete that practices the same moves and set ups over and over again until it is second nature to them when the opportunity presents itself they don't have to think about it they simply react.  This is analogous to a good trader.  The best part is you don't have to be perfect you just have to be good.  Good traders just like good athletes can perform under pressure.  More importantly they believe in their abilities and react automatically to the setups they have studied and seen a thousand times before.   Imagine if Michael Jordan paused and wondered if he should shoot or dunk each time he was passed the ball with only seconds left on the clock.

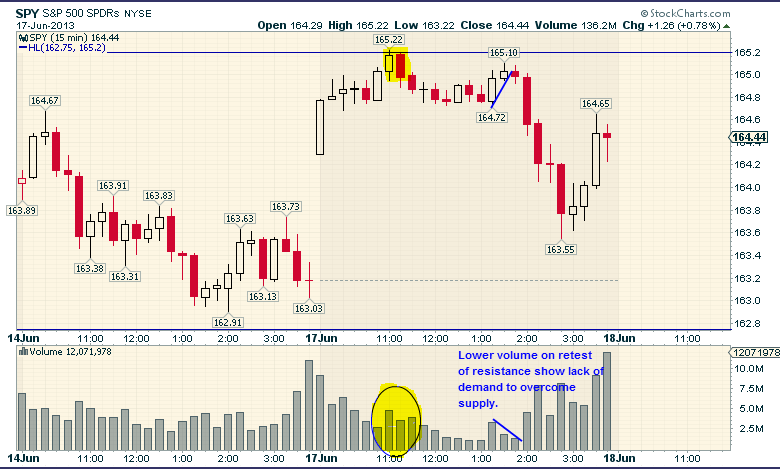
The three day rally that ensued was no surprise and where it hit resistance is even less of a surprise.  I had been expecting some type of rally based on the large volume seen on the recent down move.  I saw that as a transfer of ownership from the weak to the strong handed market players.  We saw the importance of the 1594 area acting as both support and resistance this week and watched as it broke and tested this area before rallying to a high of 1620 this week.  But why did it stop there you ask?  If you look at the daily chart of the SPX below you will see that on Thursday both the 50 day and 20 day simple moving average converged right at 1620.  I spoken extensively about the importance of the 50 day moving average (dma) on this blog as well as the 20dma.  You can read these bits of brilliance here.


To have both moving averages converge at the same point would have been a great opportunity to assess the potential of either reducing longs or adding shorts. Also note that we had a bearish cross over of these moving average not seen since November 5th 2012.  Just saying.  However, remember the larger plan here or at least one of the many set ups I believe may transpire.  We have had a relatively large volume  downmove with a resulting low volume up move.  I view the large volume as bullish especially considering it happened in and around major support levels.  However, before I can believe the market will continue to move higher I would like to see a test of the high volume area between 1576 and 1594 on lower volume and of course with these support levels holding.  Why?  Because the low volume test would signal to me that there is a lack of supply and that the previous high volume area was indeed a transfer of stock from weak to strong hands.   So lets see what happens next week as it should provide us some good opportunity.  The market is ready to pass you the ball are you going to be Michael Jordan or Sun Yue?  Who is Sun Yue?  Exactly.

Thanks for reading.


Wednesday, June 26, 2013

Principles

Important principles may, and must, be inflexible. Abraham Lincoln
Obey the principles without being bound by them. Bruce Lee

I am not sure which one the above quotes resonance with me more.  Abe Lincoln, a champion for human liberty remained steadfast to his principles even in the face of adversity. Or Bruce Lee who kicked Kareem Abdul Jabbar in the head.  Regardless of which one you shape your life by the fact is each were successful by following or obeying (as Bruce put it) their principles.  This is what this blog is all about.  Big love and principles.  The principles of supply and demand that I keep yammering on about remain the same regardless of the time frame we are looking at.  However, the principles that may not be readily apparent on the a higher time frame may appear crystal clear on lower time frame.

To demonstrate the point, yesterday we spoke again about the importance of the 1594 support and resistance level.  Yesterday it acted as resistance.  Today is was support.  If we look at the daily chart we know that the low for the day was 1594.94 but doesn't really demonstrate the principles.  The lower time frames reveals much more about and better demonstrates the battle of supply and demand.  The SPX 30 min chart below shows that price gapped up above the 1594 area at the opening bell today followed by a decline back to the 1594 area (1594.94) before the lunch time rally began.  Resistance was clearly broken at the open but it was the test of that broken resistance which was subsequently confirm as support which would have given me the confidence to go long.  What do i mean by 'confirm as support'?  We define support as an area where demand overcomes supply,  If price moved back to to the area of broken resistance and continue lower accompanied by higher volume then we know that supply was present and overcame demand.  That level would once again be considered resistance.  Instead what we saw today was price falling back to broke resistance on lower volume with the 30 min candlesticks closing off their lows as price approached the 1594 area.  This indicated that either demand was present or simply supply was lacking.  Either way demand was winning the battle at the 1594 level and a rally ensued.  Simple right?  Now try to do it in real time.  Big love for all!

Thanks for reading.


Tuesday, June 25, 2013

Time is money

You may delay, but time will not.
Benjamin Franklin
These are but two of many of Benjamin Franklin's famous quotes.  Actually, he has over 400 recorded quotes.  Benny sounded like a chatty patty.

Yesterday I spoke about the need to be patient.  Patient is usually equated with waiting.  Waiting means the passage of time.  Waiting causes anxiety in some.  I wonder if its our innate fear of time passing that causes us to be impatient.  Then we have quotes like 'Time is money' that place a monetary value on our limited time.  Or those of us that place deadlines for our success.  How many of you have already planned to retire rich from trading in the next 5 years?  Maybe this is what leads to so many bad trading decisions.  It is the need to profit quickly to meet our lofty goals essentially placing a great value on our time.  But enough of my Aristotle type babble and to the point which is you cannot 'time the market' in the sense of predicting when price will reach a certain level or target.  You must simply react when it does.

Yesterday I posted that should a rally ensue that the likely target would be the support turned resistance area of 1594.  Today's high was 1593.79.  Stop the applause please! Did I know that this was going to happen today.  No.  Actually I didn't know if was going to happen at all.  Support and resistance is not only where the battle of supply and demand has happened in the past it is also the 'time' to make a trading decision.  We react to these levels using the theory of demand and supply using volume - the main predictor of such behavior.

So why did price stop at 1594?  Price stalled at this level simply because supply overcame demand.  Plain and simple.  In order to break this resistance area demand needs to overcome supply which is the definition of support.  This is the reason why support becomes resistance and resistance becomes support.

So are we going to tank now?  Maybe.  Or maybe we simply move back to support (1578) and look at volume for clues for our next trading decision. Or maybe we break our predefined resistance area (1594).  Lets wait be patience and during this passage of time come up with some life changing quotes.

Thanks for reading.


Monday, June 24, 2013

Patience

How poor are they that have not patience! What wound did ever heal but by degrees?William Shakespeare
Beats me what the latter part of that quote means but I get the gist of it. Patience is important. As I stated so eloquently yesterday I was going to wait patiently to see how things unfolded before considering a long position.  Well the market decided to punish those that jumped the gun today by slamming the SPX 32 points lower before staging a midday rally.

I was asked the question after yesterdays post if we were at support or resistance since the market fell below the 1594 support area and rallied back up (after hitting 1578 support) to around this level at the close on Friday.  That was an excellent question and I can tell you with 100% accuracy that it was resistance after today's action.  Just kidding.  Nonetheless it is a very good question and the answer can be found by analyzing the lower time frames.

Below is the 15 min intraday SPY chart for the last 3 days.  We have labeled our support and resistance area that is in question.  The trouble started on Thursday when we broke support on increased volume.  Again in order to break support we need supply to overcome demand and that is exactly what happened.  Once support is broken it becomes resistance.  Why?  Because supply has ovecome demand which is the definition for resistance and also the requirement to break support.  See the connection!?

On Friday at the open, price gapped up to resistance and fell back until midday (something about midday and rallies?) when the market began to rally. You will notice that about 30mins before the close price again reached resistance once again before dropping for the remainder of the trading session.  Even the most naive of traders would consider that resistance.


So now what.  Well the market does look ugly and fear is definitely in the air. However, if we look at the daily SPY chart below there are a couple of things to point out.   First, volume has been decreasing on these down moves and the price is closing significantly off its lows. This signifies that demand is coming in during the session (apparently around lunch where the fat cats are too lazy to hit the sell button).  I believe patience is again required here before going long.  Although I continue to view the high volume as a transfer of ownership from weak to strong hands I would wait for a retest of this heavy volume area after a brief rally.. How far can we rally?  How about that area where supply overcame demand.  That is right ladies and gents at resistance which currently stands at 1594 level for the SPX and $159.6 level for the SPY.  With that in mind and with Billy Shakespeare's famous last words I say to you "Go get 'em champ!".


Thanks for reading!

Sunday, June 23, 2013

Quickie 2

Well the markets are much more interesting to watch these days.  When I hear or read commentary that markets are too volatile it means people are scared as it usually only comes up when the markets move down.

So lets recap what has been happening.  There sure has been a lot of volume in the past 3 days on the SPX with a price range from top to bottom of 85 points. So traders where either leaking from their bottoms or erecting from their fronts depending on if they were long or short.  

Below is the SPX 30 minute PnF chart I posted last Wednesday.  You will see, as I have shown before, why 1594 area (blue area) is an area of support.  You can also see why 1578 is also an area of support.  If don't see why let me recap.  Significant areas of support and resistance are identified by large price moves after the support or resistance level is either broken or prices bounce (up or down) from these levels. In this case, you can see that 1594 acted as an area of resistance twice before it was broken and a large up move ensued. The 1578 area also acted as an area of resistance which was broken and then after been tested (column of Os) prices moved significantly higher.  However, it is clear that the 1594 appears to be a much more significant level these days.  If you don't believe me just draw a horizontal line on your chart and see what price has done at this level.  Keep in mind that with the current daily volatility of the SPX a 16 point move from support to resistance is a bit narrow but may still serve you well intraday. 


On Friday we saw prices drop to 1577.7 (just a 1 point off our mark) before staging a triumphed rally back to 1592.43.  With the amount of volume that was registered for the past few days I'm starting to become a bit more bullish as I'm viewing this as a large transfer of ownership from the weak hands to the strong hands (just remember even the Rock Biter was no match for The Nothing).  Although I probably would not buy right now as typically there is a test of this high volume area after a brief rally.  The rally could have happened intraday which means we should see a drop back to 1578 area soon or Friday's daily candlestick could be the start of a brief rally before a possible move lower to these levels.  It is on this possible retest that I will assess if a long position is prudent.  For now I continue to watch and wait patiently.  

Thanks for reading. 

Thursday, June 20, 2013

Pump Up the Volume

Back in 1987 M.A.R.R.S released this groundbreaking track launching the age of house music and music sampling.  This song is made up of  over 250 samples! (I don't think I know 250 songs that I like).  1987 also brought the October 19 stock market crash.  Coincidence?  "Pump up the volume, rock the house, boogie down, here we go!" Could they be more blatant?  This is obviously some type of Morris code to large institutions around the world to sell the markets.  


Joking aside when I'm analyzing the markets I find myself viewing it as a big conspiracy theory to screw the retail traders out of their money. I find myself trying to determine what the large institutions intentions are by looking at my Morris code, Price and Volume.  I know it sounds flaky but fear and greed rule these markets and we humans are creatures of habit.  If you beginning to view the market not as a participant but as an outsider watching this psychological experiment known as the stock market unfold you will be quite surprised to see that the same human patterns occur time and time again.  

Raise your hand if you were long this market and found your underwear a bit heavier today.  To state the obvious, the market has been rocked in the past two days.  Today's volume on the SPY was the highest since May 18, 2012.  Its funny how the highest volume days in the past few years have all been on down days.  You can almost see the fear splattered all over the charts.  

Lets try to rationalize what lead to this nasty fall using the tenets of support and resistance, supply and demand as I have been yammering about since I start this groundbreaking blog.  Below is a daily SPY candlestick chart with our support and resistance levels I have mentioned far too many times to count. $165.2, $162.75 and $159.21 (see PnF below).

In order to break resistance we need demand to overcome supply.  On June 10th (first blue circle) price hit resistance on lower than average volume.  This indicated that there was no interest to move prices higher.  This lack of demand lead to prices falling thereafter.  The days leading up to this Wednesday's drop you can see price was moving up on decreasing volume again as it approached the resistance area of $165.20.  I won't deny that price broke the $165.2 resistance area however, I would have waited for a test of this broken resistance to confirm it as support.  That means I would have waited for price to come back down to $165.2 on lower volume (indicating lack of supply) and then a bounce above the high of the previous day ($165.99) before I would have been convinced the higher prices were in order.  Instead price tanked the next day on higher than average volume indicating supply entered the market with price closing near the lows for the day.  That was bearish.  Today we gapped below $162.75 and headed to he next level of support at $159.21 on very high volume closing near the lows of the day.


The close near the lows of the day is bearish/  Although the extremely high volume indicates a large transfer of ownership between the weak and strong hands (or what some call accumulation) has begun.  This may be the early stages of a larger drop to come in which we will look to see where the next support level it to prepare for a possible long position.  If these two last daily price bars and the associate volume had occurred after a well defined downtrend I would have viewed this as the final 'shaking of the tree' and would be more bullish.  If that were the case, then I would simply wait for a weak bounce from support and an eventual test of support on lower volume indicating supply has been absorbed.  For now I will just wait and see how things play out and tell you in hindsight how right I was. :) 

Thanks for reading

Note:  This is where the $159.21 support level came from.  Why? Significant move higher after resistance broke.


Wednesday, June 19, 2013

The Ben Bernack

Well I guess Benny said something today that the market didn't like.  Honestly, I try not to listen to the news and the gibberish that comes with it.  News influences people.  I guess this is why we have insider trading rules and regulations and the SEC to uphold these rules.  I wonder if they ever got around to talking to those Bear Sterns put holders that made off with $270 million just days after it collapsed back in March 2008.  I guess they were just lucky. This rant of mine is neither here nor there regarding today's market analysis but I'm sure it will manifests itself once again in future posts.

The traditional daily PnF chart below shows that 1640 is an area of important support and resistance.  Significant areas of support and resistance will lead to significant price moves if broken.  Otherwise the would not be considered significant.  Duh!


The 60 minute PnF chart shows a more refined area of support and resistance at 1643.  Refined means less margin of error.  If the 1643 level seems familiar it should as we spoke about this level here.   The nice thing about significant areas of support and resistance is that they don't change frequently but need to be tweaked occasionally for volatility.


The 5 min SPX chart below shows how price reacted around the 1643 area (red circles).  Yesterday when price broke above this area, price continued higher until it hit minor resistance at 1652.1 (Shown below). Today the SPX fell back to 1643 acting as support shortly after Benny's talk and continued to see much activity until it broke lower.  Price then dropped quickly as one would expect at a significant level of support and resistance.


15 min PnF chart with 1652.1 as minor resistance.


Thanks for reading


Monday, June 17, 2013

Ping Pong

Ping pong, for the culturally illiterate, is the nickname given to table tennis in England during the 1880s for the sound the ball made hitting off the paddles (made of pieces of parchment). It is not the Asian translation for table tennis.  The game itself is very similar to the stock market in that prices much like the little ball, bounces back and forth between the players defending their zone (support and resistance)  until someone with great force smashes the ball past the other (or hits them in the face) scoring that point.  

The market is currently ping ponging between a few price points.  I've been rambling on for the past week or so about the 50dma, 20dma and $165 and $162.80 as areas of support and resistance.  I've posted again yesterdays PnF chart to show why the $165 area was significant   The blue box shows what price did when $165 (in the case $165.20) broke support (supply overcame demand) and when $165 subsequently acted as resistance (supply overcame demand).  Why $165?  Because the price move was significant.  After $165 support was broken (point A) price moved lower to $160.30 on the PnF chart before reversing.  After price rallied back to the $165 (point B) area price again reversed this time dropping to $161.35.  

So what happened today?  Below is a 15min candlestick chart with the support and resistance area of  $165.20 and $162.75 derived from the PnF chart above.  Just a note that although the original numbers identified last week were $165 and $162.80, due to changes in volatility the numbers have changed slightly, which as I wrote about yesterday is well within the margin of error. The other point I'd like to make is that PnF charts are leading indicators of price (if that actually makes any sense) so you know in advance where the areas of support and resistance are to help make your trading decisions.  


Again lets hammer home the process.  We have our support and resistance areas which represent where the battle of demand and supply has happened in the past before a significant price move occurred.  We also know volume is our primary indicator of supply and demand.  So now what?  That is right..lets see what volume did at these levels!  (I now forgive you for believing ping pong was the guy that invented table tennis.)  Above you will see as price approached the $165.20 area of resistance we saw a volume increase.  However, because the candlestick at 11:00am closed near its highs I would not have considered shorting here.  We are looking to see who wins the battle of supply and demand at these support and resistance areas. An increase of volume near resistance can either mean a transfer of stock from the big boys to the small retailers (bearish) or the big boys absorbing the supply for a potential break above resistance (bullish).  So we wait and see.  With the next 15min candlestick price drops which signals to me that its the former (big boys dumping to retailers).  However, if one was so inclined to short, waiting for confirmation that indeed there was no demand for higher price levels on a potential test of the same resistance area on declining volume, would have been prudent.  Declining volume means declining demand and we know in order to overcome the overhead supply at resistance you need an increase in demand.  This is exactly what happened at around 1:30pm when price again tested resistance on significantly lower volume.  Shortly after supply came in strong with a large increase in volume with each bearish price bar closing near the bottom of the price range.  

Again we ask the question so now what.  Again I answer I don't know! However, price on the daily chart did close slightly below its 20 day moving average ($164.49) we mentioned yesterday and today's volume was the lowest it has been for the past 5 days.  Support and Resistance. Demand and Supply. Ping Pong and Table Tennis. 

Thanks for reading. 

Sunday, June 16, 2013

Quickie

After my last long winded post I've run short of time on provide actual comments on the market itself.  So this going to be a bit of a wham bam thank you mam kind of post.

$162.80 level as I've been talking about came into play again on Fridays down move finding support in that area.  Notice I said area.  The low for the day was actually $162.91.  To clarify there is an inherent margin of error with these support and resistance levels derived from Point and Figure (PnF)charts.  This is due to volatility.  If we look at the 15 min PnF chart below you can see that the $165.75 level an obvious support.  Wait a minute you said $162.80 is support and we hit $162.91 as a low before we bounced.  You are full of it!  If you draw your attention to the box size it is $0.35 meaning each box is spaced by $0.35.  Also remember that in order for a box to be filled price would have had to move at least this amount to fill an addtional box.  This is calculated by using the Avenge True Range for the last 20 fifteen min periods.  So as the volatiliy of the SPY changes so will the box size. Understand this the if we take $162.75 as a support and resistance level from chart below and its current volatility we can apply a margin of error of $0.34 on either side getting a range of 162.41-163.09.  Notice how its 1 cent shy of being exactly the next box size above and below 162.75.

Now that we got that out of the way lets look at the 5 min SPY candlestick chart and see what happened last week.  I highlight two areas where price reacted to the $162.80 area.  The first area you will notice that price broke above $162.80 on increasing volume meaning demand overcame supply.  What you will also notice is that price then came back down to test that area of broken resistance on decreasing volume indicating a clear lack of supply and then resumed its move up. That is a classic pattern that I watch for and execute on over and over again.  It clearly demonstrates that battle of supply and demand at important areas of support and resistance.


In the second area the downtrend that began in the morning slowed down as price approached support.  However, the key here was looking at how the 3 highlighted price bars continued to close near the top of its price range signifying demand was present at this support area.  Finally on the last highlighted bar price fell to $162.91 but closed near the top of its range on increased volume demonstrating a transfer of ownership from weak to strong hands.  Again demand overcame supply.  So where do we go from here?  Up?  Maybe?  There is the 20 day moving average (not shown) at $164.61 you might have to contend with.  Lets watch and see how price and volume react at these levels.


Thanks for reading.


Old and Experienced

Anyone who stops learning is old, whether at twenty or eighty. Anyone who keeps learning stays young. The greatest thing in life is to keep your mind young.Henry Ford
Henry checked out at the ripe age of 83 so I guess he was an expert on the subject but that hasn't changed my opinion that growing old sucks! Body aches are more frequent, healing takes forever, your facial cartilage continues to grow making you look more elephant than human and throwing your hip out during fervid intercourse is a distinct possibility.   Many believe that with age comes wisdom.  I believe with age comes experiences and wisdom comes from learning from those experiences and acting accordingly in similar situations.  When it comes to the trading world I have known traders and investors that gloat about the number for years that they have been in the 'game'. They all had great insight into the inner workings of the market and most of them had called 10 of the last 3 major market tops.  They could talk the talk and carry a decent conversation about the markets but seem incapable of walking the walk.  Is the human race so self-defeating that we can commit the most heinous of trading mistakes over and over again and not learn from them? Why aren't we getting any wiser?  This isn't a rhetorical question I honestly don't know.  I can only conclude that the emotions of fear and greed are too overwhelming for even the most experienced of traders to tame.

I believe there are 2 parts to a trading plan:  1) Market analysis and the execution of your analysis using proper risk and money management.

Market Analysis

Have a way of analyzing the markets in a consistent way. By consistent I mean don't flip flop between indicators or methodologies.  The new SuperDuperBigMoney indicator that Marky Markets is selling for only $199.99 isn't going to become a money making machine unless it fits into your existing analysis.  Understand that markets are a function of supply and demand.  Build on this premise and study the concepts  (like price and volume :)) over and over again.  You will come to many self-realizations that will allow you to put meaning behind the words of supply and demand and the relationship with price.   Believe in the concepts that you are studying to the point that you can explain them to others easily with clarity and confidence. Study the markets with a psychological lens.  Understand when the big boys are unusually active or disinterested and what is their intent.  Understand the tactics used to lead the retailer traders to slaughter and join the attack.  Look at your trading account as if it was the account of someone else.  If you are up congrats keep up the good work if you are down then swallow that pride without choking and admit there is an issue with your trading and fix it.  You are only fooling yourself in the end.  Validate your analysis by backtesting your rules but be honest and don't curve fit the analysis.  Again, you are only fooling yourself in the end.  Be consistent each and every time to the point that your trading seems mundane but profitable.  This will help keep your emotions in check.

Risk and Money Management

So you studied the markets for months, back tested your trading analysis and found a decent number of trade opportunities that you would execute and profit.  So what is the next step?  Of course plowing 100% of your capital into the next set up and retire.  Duh!  To be serious for a moment (only a moment) being able to analyze the markets is part of the trading plan the other part, which I believe is the most important part, is the execution. When do you get in? When do you get out? When do you know when to hold'em, know when to fold'em? Again this is the pitfall for many.  If emotion is the arch enemy of traders then maybe laying out some hard and fast rules and not deviating from them may help with the emotional aspect of trading.  I do relatively well with my directional options trading when my trading plan is executed with very strict rules.  I realized that if I was consistent with trade execution and didn't deviate regardless of what I was feeling that the merits (profit) of my trading system would reveal itself.  If I was constantly changing the rules then how would I know that my trading plan was profitable.  When I identified a trade setup I allocate the same amount of capital and set the same stop loss amount which is 2.5% of my account. Changing the allocated amount would mean that one trade set up is 'better' than another.  To me that negates the principle of consistence.  It also means that somehow I have discover some additional insight into the outcome of the trade.  The percentage I allocate is an amount I am comfortable with keeping the emotion of fear at bay.  I view each trade as a potential loser and ask if I'm okay with this loss.  I also started to look at risk and reward in terms of percentage changes vs absolute amounts, again to tame the emotions of fear and greed.  Which sounds more exciting making $2500 or 2.5%?  Use the one that doesn't get you excited.    Lastly, I always enter a stop loss and limit sell order immediately after my trade is executed.  The reason is that I cannot rely on myself to enter the order should my pre-defined profit target be reached.  I'm just too greedy! This is not to say that I won't adjust or move my stop loss up (only up) to breakeven but the idea is to automate as much of your trading as possible to remove the emotion  that leads to bad decision making.  

Thanks for reading


Thursday, June 13, 2013

50/50

I'll be honest with you, I did not think the 50 day moving average (dma) was going to hold again after yesterdays close but then again the market doesn't really give a rats ass what I think or feel.  Good lesson on why you should not follow your gut feeling especially when it may turnout to be a gastral anomaly.  Once again the 50 dma which is a widely used average by many market participants acted as a spring board for a bounce higher.  So regardless of my gastral issues I would have not shorted even after yesterdays poor close and increase in volume because of its proximity to this average.  If however, it broke the 50 dma and subsequently tested it be resistance then a short position might have been viewed as the higher probability trade. So patience would have been in order here.  But of course I saw this massive rally today...didn't everyone?  Just kidding.  What I did see was a similar set up that I posted about last week.  The 5 min chart of the SPY below reveals the same activity as we spoke about previously around the 50dma.  The only real difference was that there was no dip back into the area of support but then again this happened only 10 minutes after the opening bell and the volume, like it always is after the bell, was very high.  The transfer from weak to strong hands happened fairly quickly and the market never looked back.


On the daily chart below we went from a bearish scenario yesterday where price closed near the low of the day on increased volume to now a bullish engulfing pattern today with price closing on the highs, on slightly lower volume. So where do we go from here.  Probably back to resistance and if you read any of my poorly written posts would know that sits at $165.  When is it going to happen?  Beats me and it might not even make it there!  If it does you should be prepared to make a decision and maybe take a peak at what volume is doing if price does get there for additional clues, Most important of all is remember to take your GasX if it does and listen to the charts and not your bloated stomach.

Thanks for reading.

Tuesday, June 11, 2013

Close only counts in horseshoes and hand grenades and the money shot

$162.80! Yes that was the SPY support number pulled off our good ole PnF Chart last week and it came into  play today.  Having these numbers in your back pocket on days like today when the pre-market futures are looking ugly and those that got caught long at yesterdays close had their dreams  dashed of fast cars and hot chicks while quoting cool 'Fast and Furious' lines such as 'I live my life 1/4 mile at a time' could of made more informed decision.   Especially within the first 10 minutes of the market opening when many of them likely sold right at support (the low was $162.74) only to see it rally strong thereafter.    Unfortunately, because of commitments I was unable to post my thoughts yesterday which may have shed some light on today's decline.   So I guess you have except the following 20/20 hindsight analysis I'm about to provide!  This is why I'm never wrong! 

The daily chart below marks the $165 and $162.80 horizontal support and resistance areas we spoke about last week.  Additionally, I've added the 20 day moving average.  Just like the 50 day moving average I posted about here the 20 day moving average (dma) is a widely watched and used moving average by investors and traders alike.  So now we have a double whammy of resistance yesterday with both the $165 area of resistance from our PnF analysis and the 20dma ($165.01).   We can see from the daily volume that it was the lowest in three weeks.  The volume is sending us a message here.  I've been hammering home that support is where demand overcomes supply and resistance is where supply overcomes demand.  Our primary indicator of supply and demand is volume! Therefore, in order for support to be broken supply must overcome demand (the intelligent will realize that is the definition of resistance) and for resistance to be broken demand has to overcome supply (this is the definition of support).  The lack of volume and price closing below the $165 level meant lack of demand making a pullback highly likely.  Now I'm not going to tell you that I knew it was going to drop (although I did and it did) and of course drop back to support. This simply highlights that knowing where key support and resistance areas are ahead of time and understanding the relationship between price and volume can lead to trades with a higher probability of success. 

That is all for today so go out and find Vinny his 10 second car!  

Thanks for reading!


Sunday, June 9, 2013

Weekend Review - It was too short

“My opinions may have changed, but not the fact that I'm right.” ― Ashleigh Brilliant
Cocky son of a gun isn't he but with a last name like Brilliant I guess he can be.  So I guess it is time for the obligatory 'Weekend Review of the Markets' where I pretend that my opinions on the market actually matters to anyone.    It's an exercise of the should've, would've and could've and then I pat myself of the back realizing my hindsight continues to be a perfect 20/20!

Instead I thought I would provide an educational post and share my brilliance (no relation to Ashleigh) on finding support and resistance using Point and Figure charting (PnF).

I will use the a series of PnF charts to show how easy it is using this simple tool. Unfortunately, you will need to have a basic understanding of how PnF charts are created. So if you are interested in learning more about PnF charts, stockcharts.com provides and excellent introduction here.  I would suggest you familiarize yourself with PnF charting for two reasons 1) to help determine support and resistance in an objective way 2) otherwise you won't have a clue as to what I'm talking about.

This first chart is a traditional chart showing all the price action of the SPX since late 2011.  This is a traditional PnF chart which follows a few simple rules which you can read about here.  Currently the SPX is in a rising column of Xs and to add another X in the same column price would have to trade at least as high as 1650.  If it trades to 1649.99 a box will not be added.  Sorry these are the rules.    To reserve into a column of falling Os price would have to reverse by at least 3 box sizes, a traditional parameter, which is know as a 3 box reversal.  In this case, price would have to move by at least 30 points (box size = 10 points X 3), from the highest X in the current column (1640).  Therefore price would have to trade to at least 1610 (1640 - 30) or lower.

So we can see that price reversed at around 1680 area (actually between $1680 - $1689.99) enough to moving into a falling column of Os to 1640 before price reversed again into a rising column of Xs.  One could argue that the 1640 area was support (actually between 1640-1630.99) since priced reversed in this area.  However, a 3 box reversal is pretty common and does not constitute a significant price reversal.  Remember the goal is to find significant levels of support and resistance to help us trade.   However, price reversed again into a column falling Os and after breaking the previous 1640 area of support prices fell significantly to the 1600 area (which was a previous level of support between 1590-1600) before again reversing.

 
So lets hone in on the 1640 and 1600 areas of support and resistance and lets change the box size from 10 points to 5 points and begin to refine our support and resistance target from a 10 point range to a 5 point range.  We can now zoom in on the 1645 areas which is still within the 10 point range from 1640 area above.  You can now see that price broke below the 1645 area and then came back up to test that area again before reversing again at that level.  You can also see that 1595 was a level of resistance back in April and that level came into play again just this week when price came down to 1598 to find support. Now we have a 5 point range of 1640-1645 and 1595 to 1600.   Following?


Now don't get me wrong a 5 point range on a 1600+ instrument is pretty good but lets get even closer and jump to a 30 minute chart below.  The box sizes of the 30 min PnF chart is calculated using the Average True Range for the last 20 periods (30mins) and therefore the values will change as volatility changes.  However, if we are looking at significant levels of support and resistance this shouldn't change those levels significantly, if they did then they the are probably not significant or just wrong.  If we look at the 1643.4 area you will see the how price reacts as it breaks and then acts as resistance.  Similarly you will notice our upper range of support of 1600 has been lower to 1598.8. Therefore, we have narrowed the range from 5 points to now 3.8 points or a range of 1595-1598.8 which is pretty darn good.  Getting clearer?


Did you notice how we closed Friday back at resistance 1643.4? Coincidence?  Maybe?  Does it mean price is going to fall?  Maybe? It might go higher. The idea here is to react to what prices do at these areas of support and resistance.  Maybe looking at volume might help in our decision making at these important levels since these area represent the battle of supply and demand.   Maybe that will be my next post. :)

Did this make sense? Then reread it. :)

Thanks for reading.


Thursday, June 6, 2013

50 Shades of Grey

Haven't read it.  It's referred to as 'mommy porn'.  I'll wait for the 'daddy porn' version. Although the 'The Fifty Shades of Gay' parody sounds amusing.   As I mentioned in my last post we were expecting a move to the 50 day moving average (dma) to act as support.  Now the logical question would be why is the 50dma important? Why would it act as a support and resistance area?  Who knows and really who cares.  What is important to understand is that it is widely used by many investors and analysts.  My goal is to find significant levels of support and resistance and analyze the activity around these levels using volume to better understand what price has and may potentially do.  I view the 50dma as a freebie.  It's readily available and we know its an important psychological level for many traders (except for those clever folks that think using a 51dma somehow provides a trading edge).  We also know that many traders will place stops (both buy spots and stop losses) in and around the 50 dma.  So do the professionals who will use that to their advantage to shake you out of your positions by running your stops and buying when you are selling and selling when you are buying.  Yes, its a conspiracy theory!  Where is Jesse Ventura when you need him!

With this in mind lets take a look at what happened today with the SPY.  In our previous post we identified $162.80 as a level of broken support which lead to us anticipating a move to the 50dma which was at $160.48 as of yesterdays close and rising.  As you can see from the 5 minute SPY chart below the amount of volume increased considerable when price reached $160.48 (blue line).  What is especially interesting to note is the bar at 12:25am when price broke below the 50dma on significantly higher volume but price closed near the highs.  If I had to guess I would say that the stops where taken out and the small guy was selling (getting stopped out) to the big guy that was buying.  Remember the definition of support is where demand overcomes supply.  Volume represents the level of activity of demand and supply  The price closing above support with the hammer candlestick and high volume all indicated bullish behavior.  

Again, I would have waited for confirmation of the $160.48 support area by waiting for a successful test before initiating a long position.  Why?  Because I've found that at areas of significant support and resistance area there will always be test of that level on one of the lower time frames.  I believe the test is a way of confirming that the remaining supply (demand) has been removed represented by lower volume on the way down (up) to test the support (resistance) area.  This is exactly what happened 30 minutes later at 12:55am when price came back down on significantly lower volume to test the $160.48 area of support before rallying.  Pretty interesting I would say.  What is even more interesting is how price closed just 7 cents shy of the $162.80 resistance area!  Someone call Mr. Ventura ASAP!!!

Thanks for reading.


Wednesday, June 5, 2013

Don't try to catch a falling knife

Don't try to catch a falling knife!
The person that came up with that saying was obviously not a ninja.  Speaking of things falling the market was taken to the woodshed today (don't you love these English idioms),  I'm sure there are a lot of bears out there pounding their chests tell you they saw it coming and I'm sure some did but I'm sure  the rest 'saw it coming' since going short in late November 2012.  So how could someone, if they were so inclined, have seen this drop coming.  The reality is most retail traders believe they know exactly where the market is heading and lose money and I believe its that conviction (a synonym for stubborn) that is their trading downfall.  They anticipate when they should react.  Let me explain what I mean for the less gifted (intelligent).  The definition for anticipating and react is as follows:

Anticipating:  Guess or be aware of (what will happen) and take action in order to be prepared.

React:  Respond or behave in a particular way in response to something:

Trying to anticipate tops and bottoms is synonymous with guessing and usually traders find themselves jumping the gun on a trade. There must be some type of innate need or maybe something programmed by the society we live in that we have to be first in everything in order to prove ourselves better than the next person.  It is the only rationale I can think of that would make one so anxious to get into a trade in hopes of an imminent reversal of a prevailing trend.  Unfortunately, far too often the rationale for the trades come only after the trade is executed and is backed up with sound analysis such as '...the price fell  so much it has to bounce!'  or '.....I bought at double the price let me average down!'.  All solid reasons in there own right and I'm sure their trade account balances reflect the merits of that analysis.  

Reacting in the context of trading, means to respond in a particular way to a market move. Anticipating a move is a precursor to reacting to the expected move.  Reacting requires patience, a control of emotions and to be devoid of pride and ego understanding that its okay to not pick the exact top or bottom and that waiting for the move to transpire and get on early enough results in a trade with a higher probability of success. 

So with that in mind lets look at today's SP500 action and see what so many already knew what was coming! 

First you will notice that I had predefined levels of support and resistance taking from a 30 minute PnF chart from June 4th.  On an intraday basis 165.00 and 162.80 are support and resistance areas.  This is key because knowing these levels ahead of time will help eliminate the need to anticipate a move.  I always tell people that I don't have to make a decision until price reaches a predefined level of support and resistance.  


So as you can see on the 5 min SPY chart below we plotted those predefined levels of support and resistance.  Here is where the concept of reacting vs anticipating is important.  In the morning, at approximately 10:10AM the market quickly fell to $162.80.   If I had anticipated a bounce from that support level I would have simply bought at this level.   Instead I opted to wait to see how the next bar closed to confirm my expectations of a bounce.  The next 5 min bar broke and closed below support ending on the low with the highest volume bar at that point.  To me that signaled supply entering the market. Again, I could have anticipated now a move lower and entered a short and as you can see that would have been profitable trade.  Instead, I always tend to wait for broken support (especially on high volume) to be tested and confirmed as resistance.  (Remember my definitions of Support and Resistance).    That is exactly what happened at 10:30AM.  After a weak bounce back into what was now resistance on lower volume it was at that point that a short trade had a high probability of success.   See how easy that was in hindsight! :)  'Brilliant!' you are thinking.  So where do we go from here?  I anticipate a move lower to either the 50 daily moving average at $160.48 and if that doesn't hold then $159.50 (hint: check the PnF above).   Thanks for your reading!

Tuesday, June 4, 2013

In the beginning - The Strategy

"For the love of money is a root of all kinds of evils. It is through this craving that some have wandered away from the faith and pierced themselves with many pangs."

1 Timothy 6:10

That Tim fellow sure had some powerful insight on human behavior and it looks like things haven't changed all that much two thousand or so years later.  Yeah! Greedy people rock!  We humans are creatures of habit and the old adage that the market is based on fear and greed has never been more true.

So what is my point?  Good question.  My ADHD aside my point is that the market just like people has a mannerism to it that is understood and exploited by professionals.  Simply put the tendency is to get greedy at the top and fearful at the bottom and lose money.  But don't feel bad because this is exactly what is expected of you by those that understand the human psyche (and can control their own) to make them profitable.  See you do serve a purpose in this world.  Now this is nothing original by any stretch but it does make up the basis of my trading strategy, which is to try to identify potentially profitable trading opportunities during times of fear and greed.  I said 'potentially profitable' because there is no holy grail here kids.  We are searching for high probability set ups.

My tools are not very impressive but the way I use these tools is what I think is important.   Price and volume are my weapons of choice.  You will NOT see a MACD (I remember the first time I heard someone can it the MAC-D I thought of McDonalds), no RSI, no Stochastics, no <Insert the Last Name of some mathematician> Indicator on any of my charts.

I use Point and Figure (PnF) charts to analyze price action.  This simple but powerful chart of just Xs and Os is all I need to identify major support and resistance levels with pinpoint accuracy that I can use to trade.  Very few people I know actually use PnF charts which I think is why I like them so much.  I have to feel special.  However, my analysis of price is two fold:  1: To determine significant levels of support and resistance  2:  Analyze the price range for a specific period of time to assess the strength of the price move for that period.

Volume is always analyzed with respects to what price has done.  I believe that volume is the primary indicator of supply and demand. When analyzing price (i.e. support and resistance levels) with volume analysis (i.e supply and demand) a very simple and powerful tool set to assess market movements arises like a phoenix from the ashes of your trading account.  The plan of this blog besides to amuse myself is to show this in action and provide a perspective on how I analysis the markets. 

So here is my trading secret ladies and gents! 

Support = Demand overcomes Supply
Resistance = Supply overcomes Demand
Support is broken when Supply overcomes Demand (definition of Resistance)
Resistance is broken when Demand overcomes Supply (definition of Support)

Don't worry this will make more sense over time as you follow me on this fruitless and thankless  journey of charting the markets using the simple tools I've described.

Thanks for reading!